
SystemDataScope

SystemDataScope is a GUI for visualization of collectd datasets. Together with collectd and RRDtool, it provides a system monitoring solution for Sailfish. Upgrade and this release notes are below. See also below for possible problem with SFOS 2.0.2 upgrade.
SystemDataScope reads the system performance data gathered by collectd. Graphs are generated using RRDtool and shown through provided GUI. If collectd is started by a GUI user through systemd, there is a support for starting/stopping the daemon.
Through process plugin of collectd, each program can be monitored with its RAM, CPU and disk access logged and shown on graphs through longer timespan.
The recorded statistics are kept with different time resolutions allowing to keep short-term (hours) as well as long-term data (year).
NB! Updates are currently posted at Chum repositories only
Reports
SystemDataScope can be used to generate report images that can be used for giving feedback on performance of your device or monitoring results on an app(s) that you selected in collectd configuration. By selecting "Report" in pulley menu, you would initiate generation of the graphs that will be stored, in Sailfish, under /home/nemo/Documents/SystemDataScope/TIMESTAMP. When the report graphs are all ready, a message will appear in SystemDataScope. With the file manager or Gallery app, select and send graphs that you want to share and delete the folder /home/nemo/Documents/SystemDataScope when not needed. This folder will be created if its missing the next time you would need a report. An example report graph is shown as one of the screenshots below.
Default configuration
The collected statistics are organized in a tree. In the beginning, a list of graphs on a top level are shown. By pressing on a graph, a detailed information regarding that statistics is shown on a list, if it exists. At present, using such scheme, there are three levels used.
The default configuration for collectd provides data on:
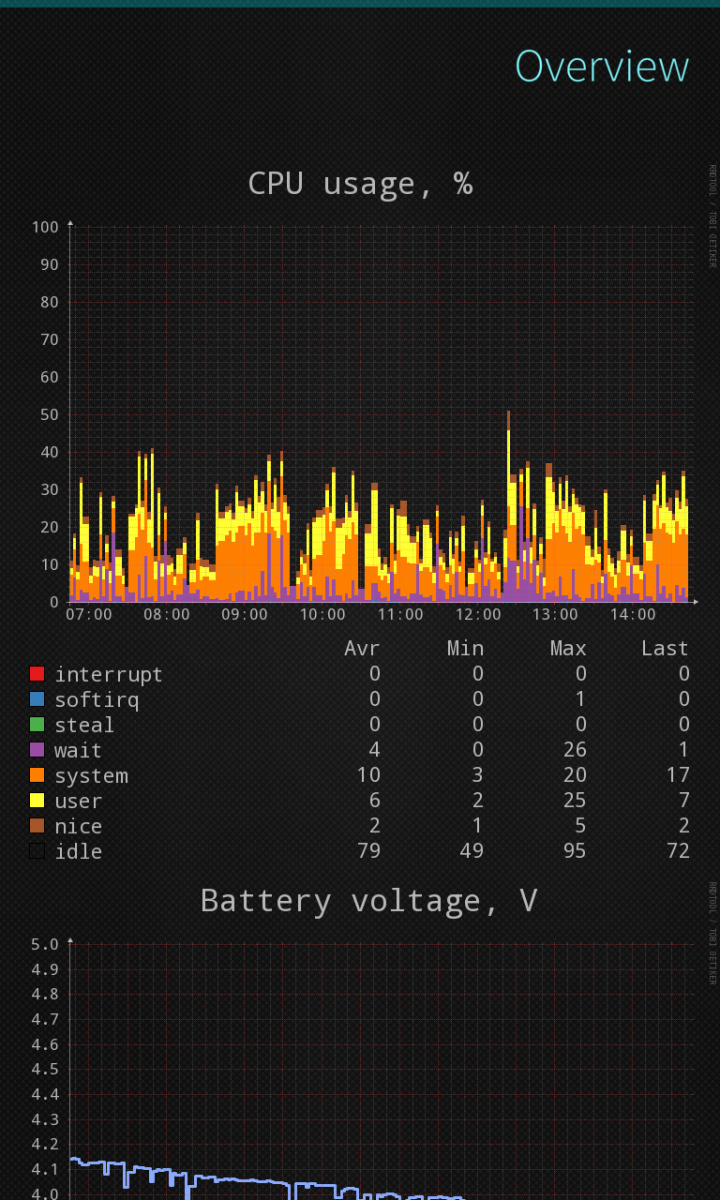
- CPU
- CPU usage (system, user, nice, idle, ...)
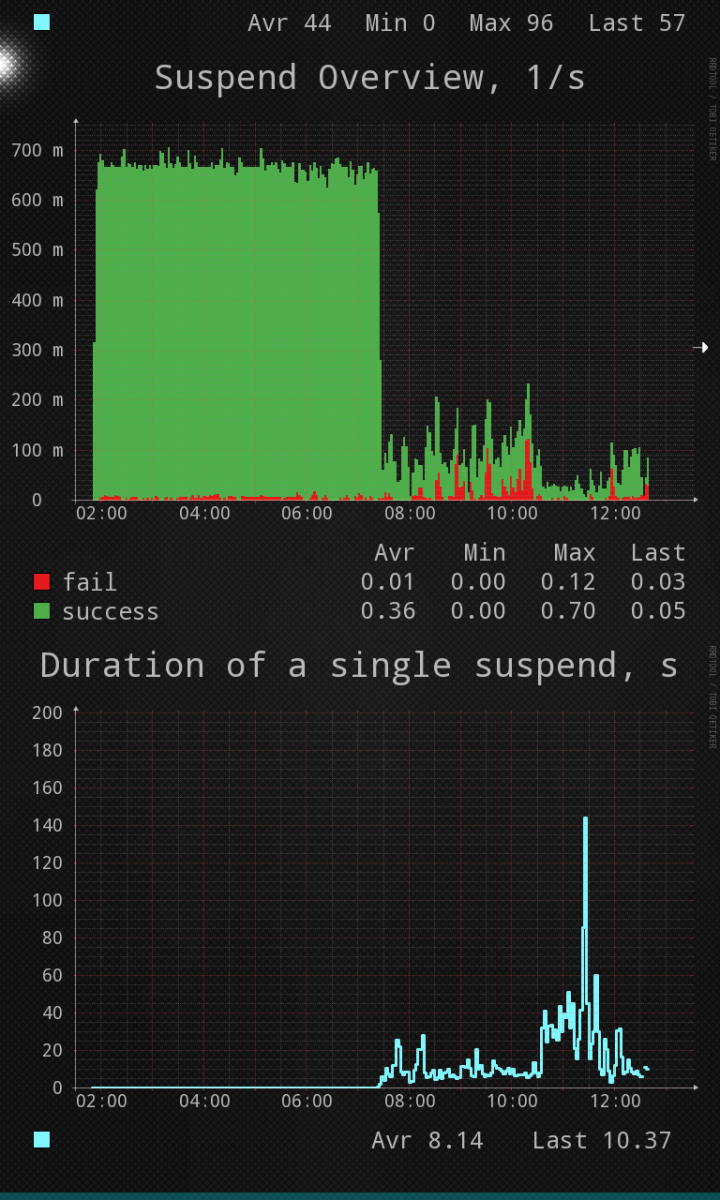
- Amount of time spent in CPU sleep
- CPU sleep (time; suspend attempts; duration of an average suspend)
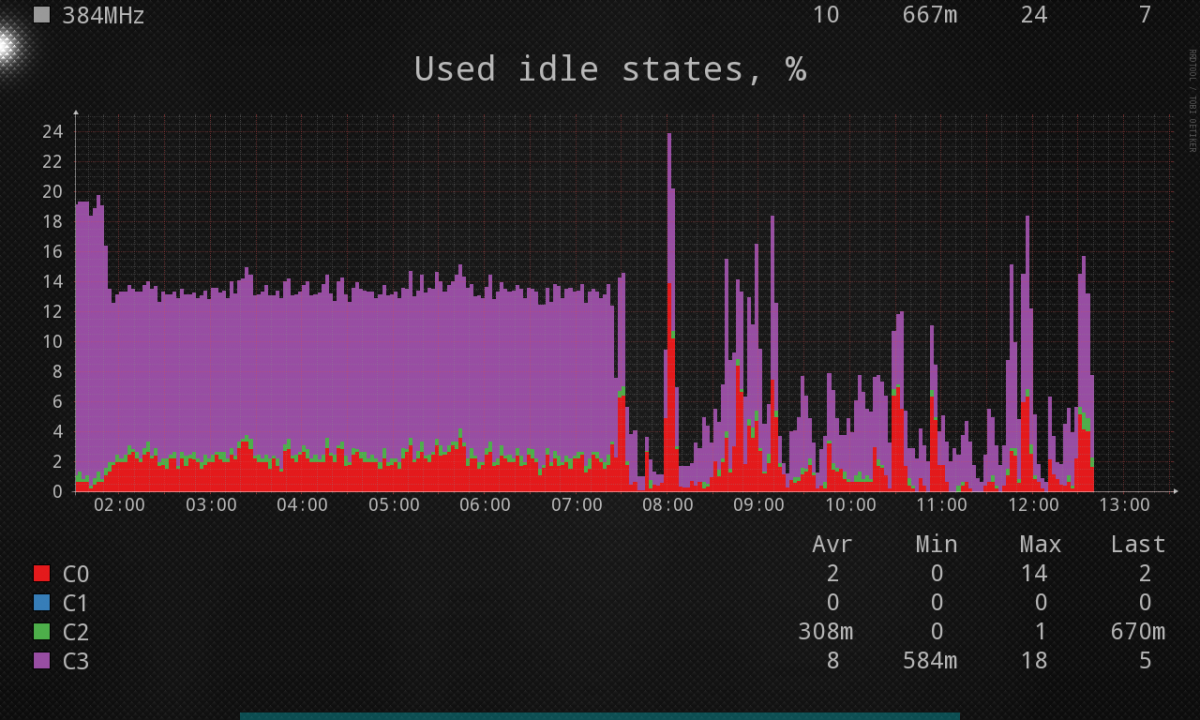
- Used CPU frequencies
- Used CPU idle states
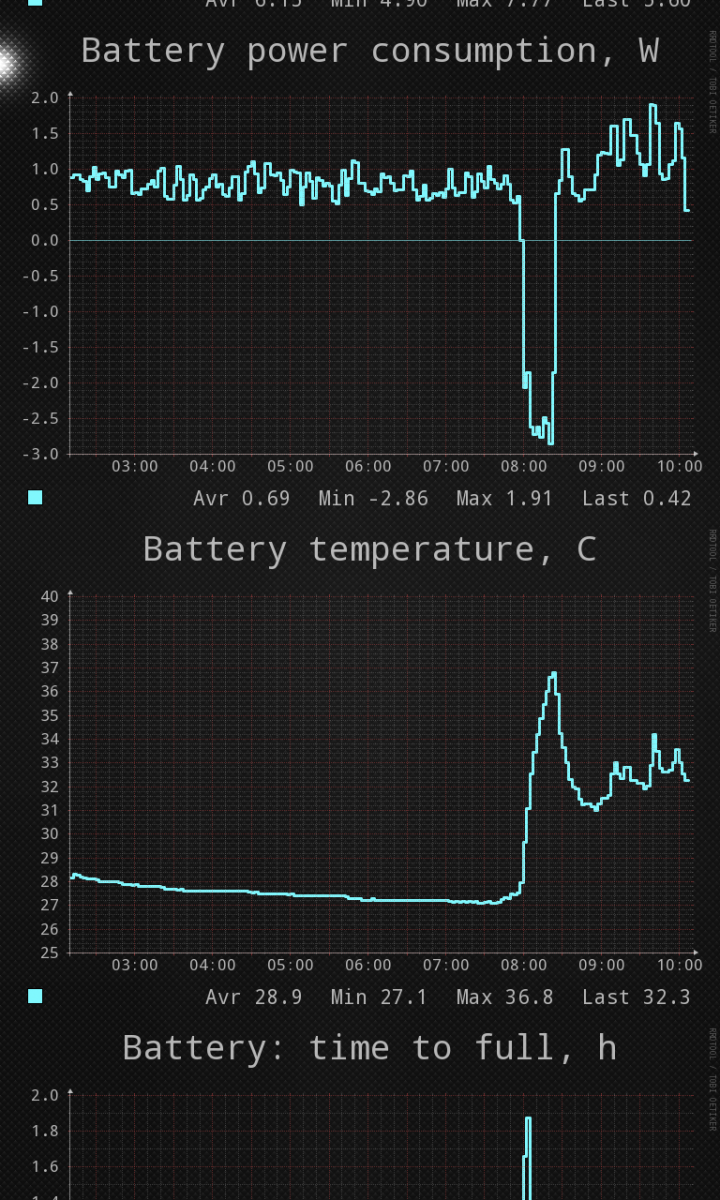
- Battery (charge, current, energy, power consumption, temperature, time to full/low, voltage)
- Memory and storage
- RAM usage (free, used, cached, buffered, ...)
- Storage usage
- root partition used and free
- disk stats (I/O time, traffic, operations per second, ...)
- Network
- Overall traffic
- Traffic on cellular and WiFi interfaces
- For each interface: traffic, accumulated traffic over displayed time period, errors, packets per second, packets dropped
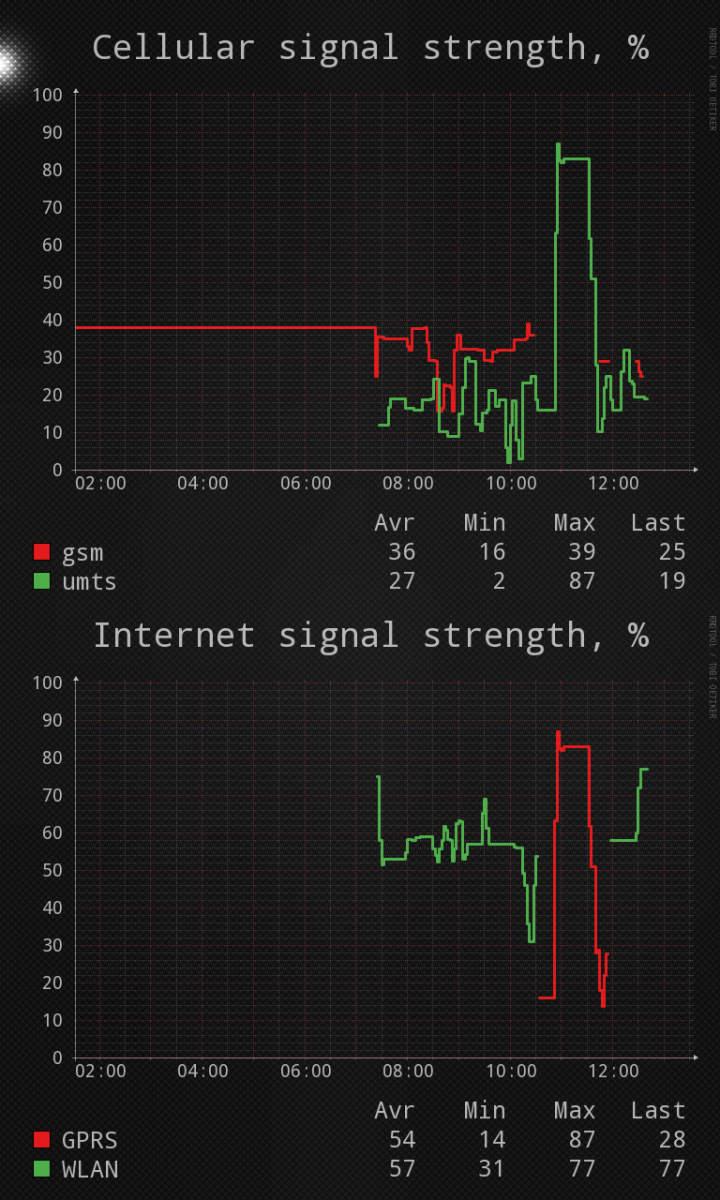
- Radio details:
- Cellular and used internet radio (wifi or cellular) signal strength
- Whether WiFi or Bluetooth are switched on
- Bluetooth radio: connected, visible, enabled
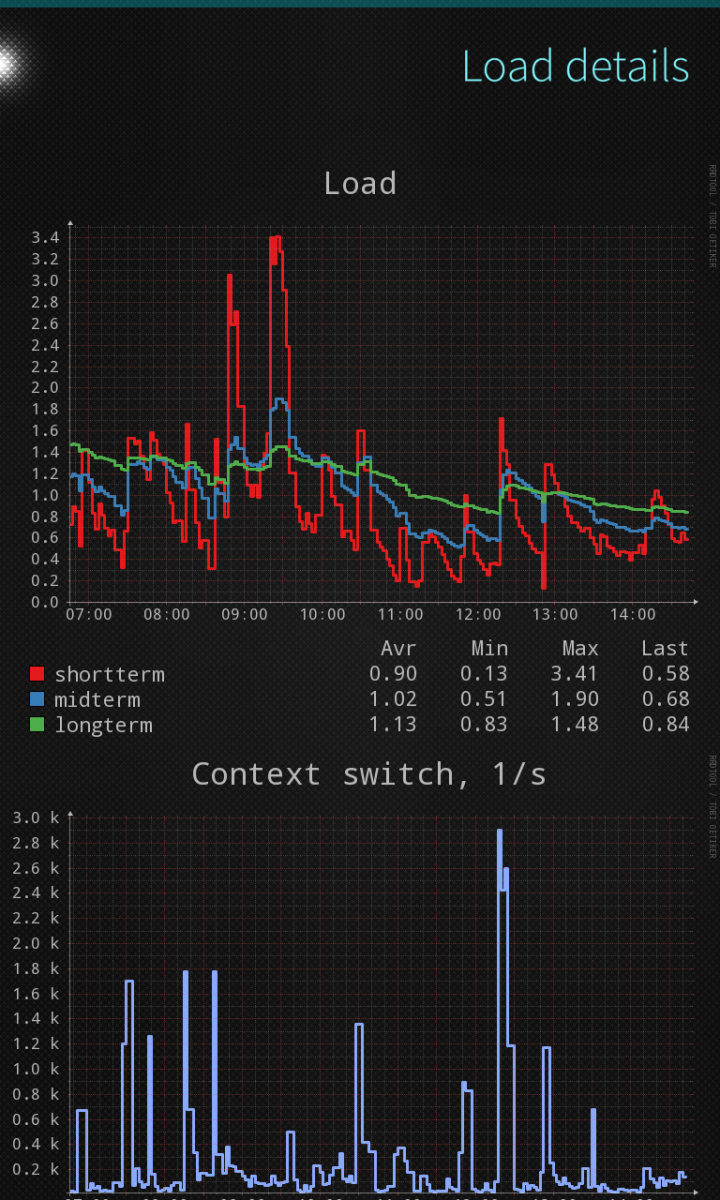
- Processes and Load
- Number of processes in different states (running, stopped, zombies, ...)
- Fork rate
- Load
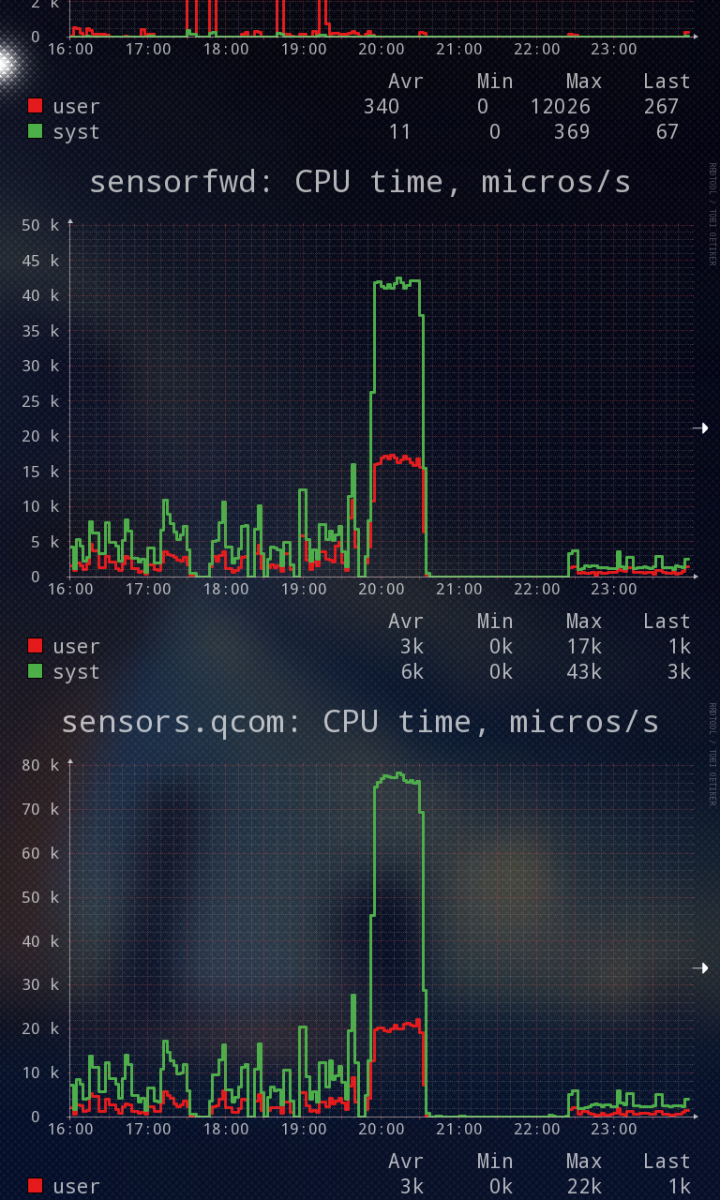
- You could monitor the processes you are interested in. For each of them, you get data on CPU usage, RAM usage (rss, code size, virtual memory used, ...), number of running threads and processes, disk traffic induced by the process
- Uptime
SystemDataScope is build to support multiple different log configurations. The configuration is setup through JSON file that can be autogenerated, specified by user, or downloaded from URL (local or remote). This should facilitate development of the graph generation scripts that are tailored for specific user setups.
Since some statistics are populated as you use the phone, such as used mobile network type, regenerate the configuration after a while again to see the corresponding radio signal strength.
The current implementation is developed on Linux Desktops and Sailfish OS mobile devices.
If something does not work, please send your bug reports via GitHub by opening an Issue (see GitHub page below). It is an open-source project and its an easiest way to contribute to it. If you have improvement suggestions, send them also via GitHub by opening a new issue. Developers are welcome to join.
Upgrade notes:
To get support for new collectd plugins, just regenerate graph configuration. Note that the new stats have to be supported by the generation script.
Upgrade notes for users of collectd versions 2016.07.17-6 and earlier:
For details, see collectd OpenRepos page ( https://openrepos.net/content/rinigus/collectd ), under upgrade notes. In short, for default collectd configuration users, please delete the old datasets and start with the new default configuration (will delete earlier data). For that, stop collectd and remove /home/nemo/.local/share/collectd ( in terminal: rm -rf /home/nemo/.local/share/collectd ) and start collectd again. While the data will be lost from earlier recordings, new databases will be initialized allowing you to record data for 1 year.
SFOS 3.4.0.x
As StateFS is not installed by default, users have to install the missing StateFS support:
devel-su pkcon install statefs statefs-provider-bluez statefs-provider-connman statefs-provider-mce statefs-provider-ofono statefs-provider-power-udev statefs-provider-profile statefs-provider-qt5
Reboot after installation. After that, collectd will be able to start normally.
SFOS upgrade to 2.0.2 series
This may concern users who have been using collectd/SystemDataScope before upgrading SFOS to 2.0.2. On my device, the upgrade from 2.0.1 to 2.0.2.51 resulted in a change of a hostname from Jolla to Sailfish. As a result, collectd started to record under different folder with the graphs not updated in SystemDataScope. If you have the same problem, stop collectd, move your records to the new folder under .local/shared/collectd, delete old subfolder from where you moved the records, and regenerate the graph definitions in Settings. Start collectd and your old records will be updated as before.
Hopefully, Jolla will not be changing SFOS hostname default frequently. Otherwise, you could also set the hostname or specify folder in /etc/collectd.conf .
Homepage: https://github.com/rinigus/systemdatascope
License: MIT
Official TMO thread: http://talk.maemo.org/showthread.php?t=97756
Donations: https://rinigus.github.io/donate
Screenshots:


Category:
Keywords:
Application versions:
| Attachment | Size | Date |
|---|---|---|
| 108.14 KB | 24/07/2016 - 08:04 | |
| 113.85 KB | 24/07/2016 - 08:04 | |
| 109.42 KB | 03/08/2016 - 10:25 | |
| 115.11 KB | 03/08/2016 - 10:25 | |
| 110.65 KB | 31/08/2016 - 20:29 | |
| 116.52 KB | 31/08/2016 - 20:29 | |
| 116.52 KB | 03/10/2016 - 23:24 | |
| 123.72 KB | 03/10/2016 - 23:24 | |
| 122.77 KB | 24/12/2017 - 14:00 | |
| 116.92 KB | 24/12/2017 - 14:00 | |
| 121.58 KB | 15/03/2021 - 11:12 | |
| 131.05 KB | 15/03/2021 - 11:12 | |
| 124.45 KB | 15/04/2021 - 21:03 |
Comments
rinigus
Mon, 2016/07/04 - 22:59
Permalink
Thank you for the feedback!
This is strange that you get two directories under /tmp/collectd: jolla and Jolla. I have only Jolla and it maybe due to the hardware adaptation on Nexus 4. Which phone/tablet do you have?
Just a bit info for background. When you start collectd, systemd runs a small script that takes folder from /home/nemo/.local/share/collectd and syncs it to /tmp/collectd. As soon as you stop collectd, the same script syncs it back. NB! If your device crashes, you would loose the recorded data since the last stop. I have been trying to get systemd timers to sync data, but they seem to be very unreliable
In your case, for some reason, you have 2 subfolders in /tmp/collectd. One of them has a real data: /tmp/collectd/Jolla. What's in the other one, no clue (maybe you could post ls /tmp/collectd/jolla ?). To see data when you stop, go to Settings and set the corresponding folder to /home/nemo/.local/share/collectd/Jolla (same Jolla as in /tmp).
If you see graphs in Overview then you could navigate to more specific graphs by touching the graph. The graphs that can be navigated 'into' are marked with a small right arrow on the right of the graph.
It seems that configuration part is rather confusing and messy. If you have an idea how to improve it, please go to GitHub and open an issue. There it would be appropriate to discuss how to improve the GUI
PamNor
Mon, 2016/07/04 - 20:05
Permalink
Running python script
Loading file:///home/nemo/myconf.json
No graphs in overview
Only pulley menus.
Status:
collectd: running
RRDtool: running
Running SystemDataScope from terminal give error like:
[W] unknown:189 -file:///usr/lib/qt5/qml/Sailfish/Silica/DialogHeader.qml:189: TypeError: Cannot read property 'BackIndicatorDown' of null
edit1
myconf.json 9.96kb
/tmp/collectd/Jolla
/home/nemo/.local/share/collectd/jolla
Have to start my laptop to link you downloadlink from dropbox. could takr some time.
hmm..
rinigus
Mon, 2016/07/04 - 20:12
Permalink
Regarding the warning - I have seen it and it seems harmless (everything works with it)
rinigus
Mon, 2016/07/04 - 20:11
Permalink
10kb is not much - mine with the default settings is towards 300k. So, something got undetected. I get 10k size, if I use a wrong directory. Did you specified as a root for collectd /tmp/collectd ? You should get a directory below that. On my Nexus 4, its
/tmp/collectd/Jolla
So, the script should be on my phone
systemdatascope-makeconfig /tmp/collectd/Jolla > myconf.json
If your phone sets different hostname, you would get something different under /tmp/collectd
rinigus
Mon, 2016/07/04 - 19:50
Permalink
That's should be easier to fix.
After running a script, you should get myconf.json in your home dir: /home/nemo/myconf.json
That's if you redirected its output to that file. So, when you load, you should use:
file:///home/nemo/myconf.json
Thank you for testing, its of a great help!
EDIT: now I can see that you have put the correct path in URL. Can you send the json config by pastebin or some alternative?
EDIT2: or at least how large is it and whether its similar to https://github.com/rinigus/systemdatascope/blob/master/configs/sfos-n4.json
EDIT3: And what are you directories in Settings?
PamNor
Mon, 2016/07/04 - 16:25
Permalink
Running Sailfishos 2.0.1.11 (arm).
rrdtool: installed
from terminal:
systemdatascope
..
...
[w] unknown:-1 - file:///usr/share/systemdatascope/qml/main.qml: file not found
[edit]
I cannot find qml folder. main.qml i in folder systemdatascope
rinigus
Mon, 2016/07/04 - 16:38
Permalink
PamNor, please try the new version. It should have fixed the wrong location of QML (that's what happens when you develop for desktop & sailfish at the same time and don't want to include desktop QMLs into sailfish package) :)
Please let me know if it helped
PamNor
Mon, 2016/07/04 - 16:46
Permalink
SystemDataScope is starting now.
I will continue testing .
Thanks.
rinigus
Mon, 2016/07/04 - 16:47
Permalink
Thank you very much for reporting it!
rinigus
Mon, 2016/07/04 - 16:26
Permalink
PamNor, excellent! It seems to be a bug due to packaging. Please uninstall SDS GUI and I'll update it to a new version. Just wait a bit...
rinigus
Mon, 2016/07/04 - 16:09
Permalink
very strange - maybe something went wrong during install. QML files should be there. If you do
ls /usr/share/systemdatascope/qml
do you see the files? There should be main.qml, other QMLs from https://github.com/rinigus/systemdatascope/tree/master/qml, directory Platform.silica and a symbolic link Platform->Platform.silica .
If these are absent, maybe something happened during install. Try to reinstall it. Maybe download RPM manually and install with
pkcon install-local ....rpm
PamNor
Mon, 2016/07/04 - 15:26
Permalink
Gui start loading for 30 sec and then quits. SystemDataScope process continue to run. Tried to start collectd from terminal in forehand,but no difference. chmod 666 /var/log/collectd.log, no difference.
rinigus
Mon, 2016/07/04 - 15:46
Permalink
PamNor, sorry to hear about. Let's try to fix it. In general, GUI should run without collectd started and is supposed to display you a help screen. So, let's keep collectd out of the way and fix GUI first.
Just few questions:
As for collectd, it should be started via systemctl --user and, as far as I have seen, all its messages end up in system journal (journalctl as devel-su). But let's fix GUI startup first.
Pages