
SystemDataScope

SystemDataScope is a GUI for visualization of collectd datasets. Together with collectd and RRDtool, it provides a system monitoring solution for Sailfish. Upgrade and this release notes are below. See also below for possible problem with SFOS 2.0.2 upgrade.
SystemDataScope reads the system performance data gathered by collectd. Graphs are generated using RRDtool and shown through provided GUI. If collectd is started by a GUI user through systemd, there is a support for starting/stopping the daemon.
Through process plugin of collectd, each program can be monitored with its RAM, CPU and disk access logged and shown on graphs through longer timespan.
The recorded statistics are kept with different time resolutions allowing to keep short-term (hours) as well as long-term data (year).
NB! Updates are currently posted at Chum repositories only
Reports
SystemDataScope can be used to generate report images that can be used for giving feedback on performance of your device or monitoring results on an app(s) that you selected in collectd configuration. By selecting "Report" in pulley menu, you would initiate generation of the graphs that will be stored, in Sailfish, under /home/nemo/Documents/SystemDataScope/TIMESTAMP. When the report graphs are all ready, a message will appear in SystemDataScope. With the file manager or Gallery app, select and send graphs that you want to share and delete the folder /home/nemo/Documents/SystemDataScope when not needed. This folder will be created if its missing the next time you would need a report. An example report graph is shown as one of the screenshots below.
Default configuration
The collected statistics are organized in a tree. In the beginning, a list of graphs on a top level are shown. By pressing on a graph, a detailed information regarding that statistics is shown on a list, if it exists. At present, using such scheme, there are three levels used.
The default configuration for collectd provides data on:
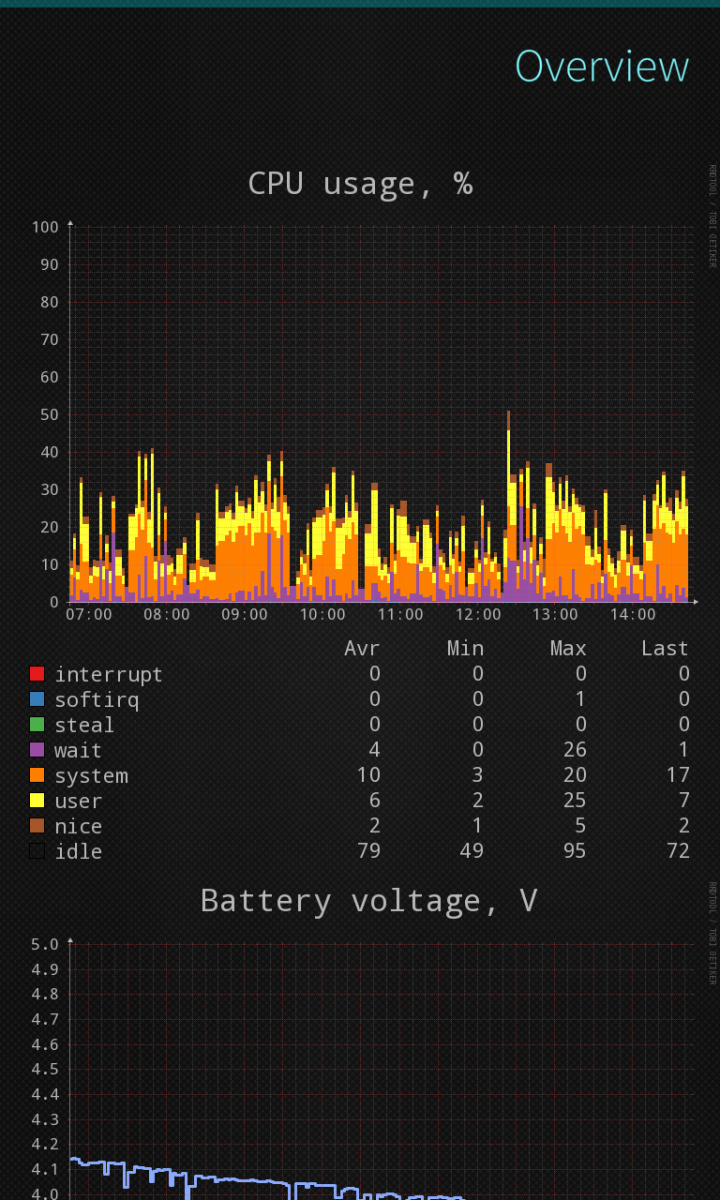
- CPU
- CPU usage (system, user, nice, idle, ...)
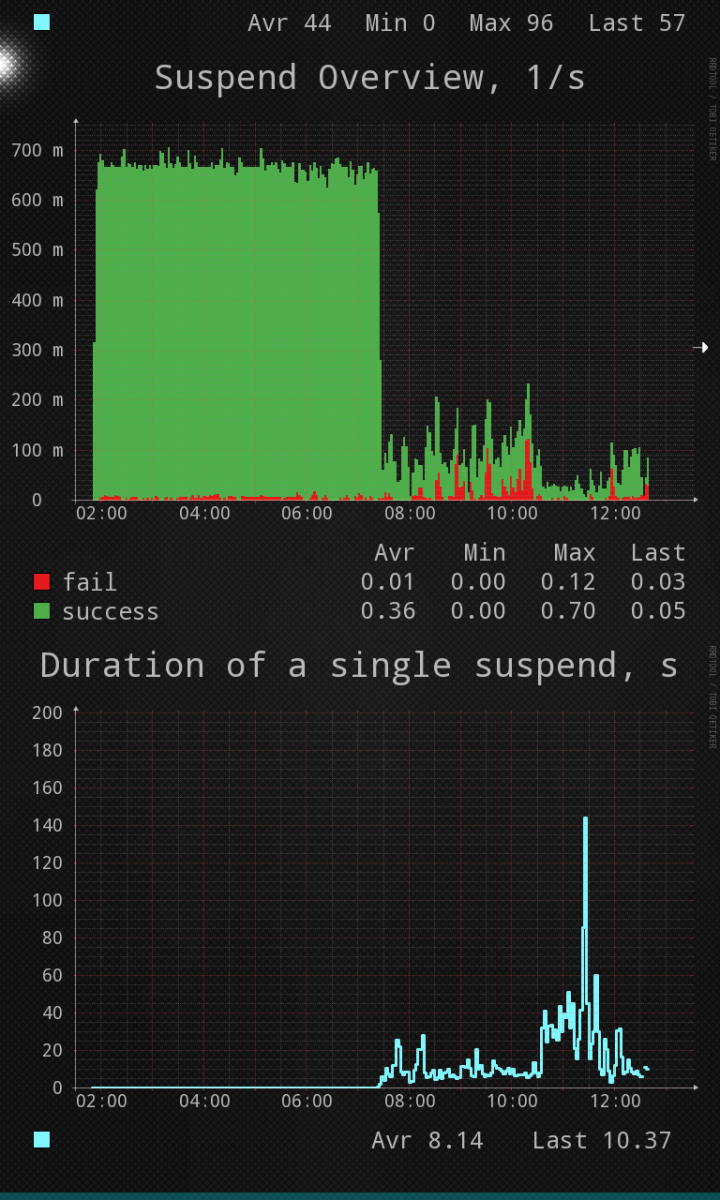
- Amount of time spent in CPU sleep
- CPU sleep (time; suspend attempts; duration of an average suspend)
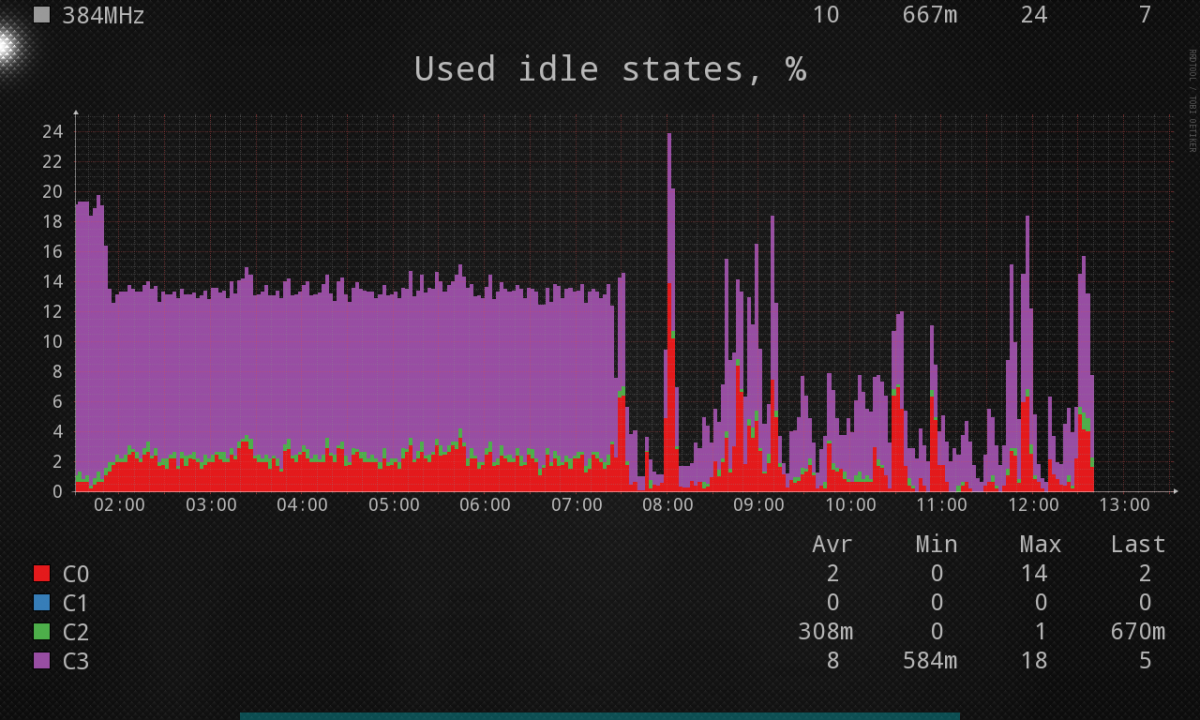
- Used CPU frequencies
- Used CPU idle states
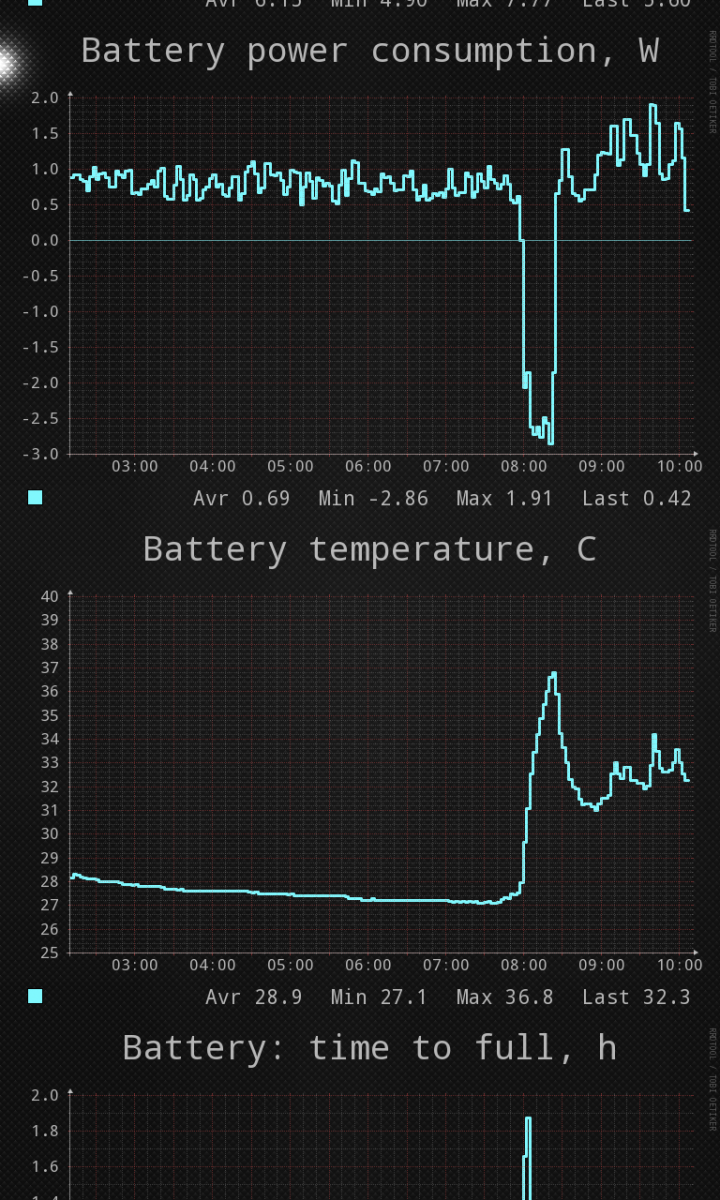
- Battery (charge, current, energy, power consumption, temperature, time to full/low, voltage)
- Memory and storage
- RAM usage (free, used, cached, buffered, ...)
- Storage usage
- root partition used and free
- disk stats (I/O time, traffic, operations per second, ...)
- Network
- Overall traffic
- Traffic on cellular and WiFi interfaces
- For each interface: traffic, accumulated traffic over displayed time period, errors, packets per second, packets dropped
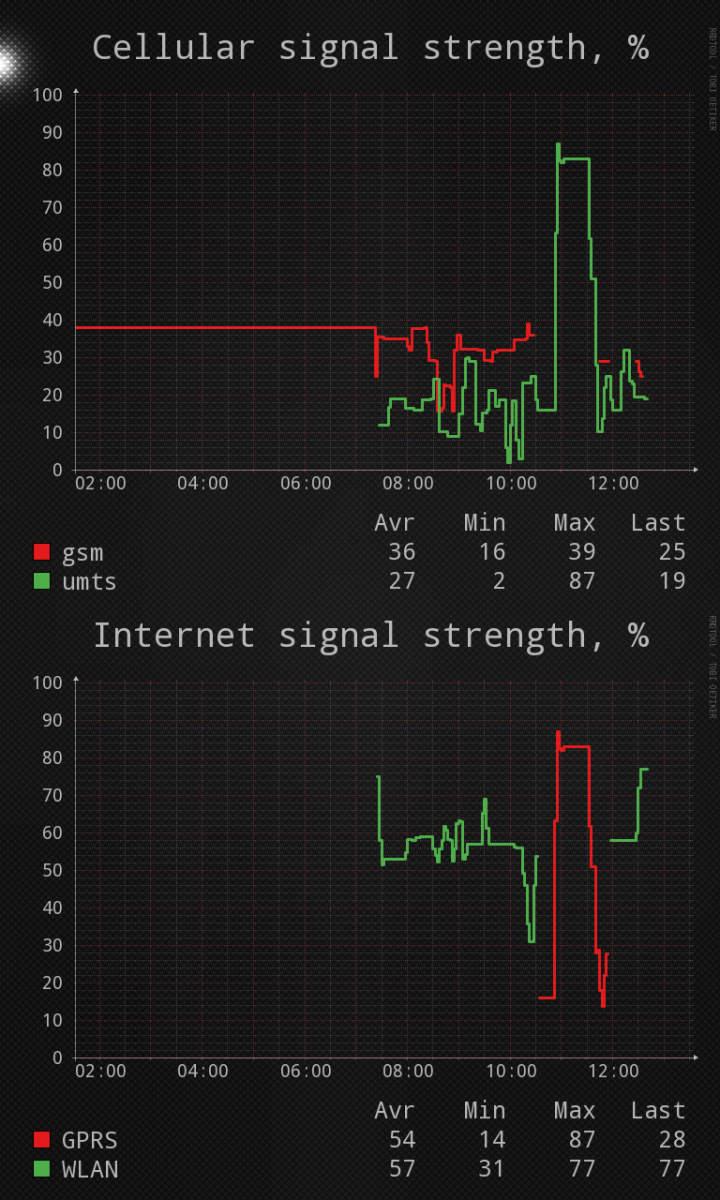
- Radio details:
- Cellular and used internet radio (wifi or cellular) signal strength
- Whether WiFi or Bluetooth are switched on
- Bluetooth radio: connected, visible, enabled
- Processes and Load
- Number of processes in different states (running, stopped, zombies, ...)
- Fork rate
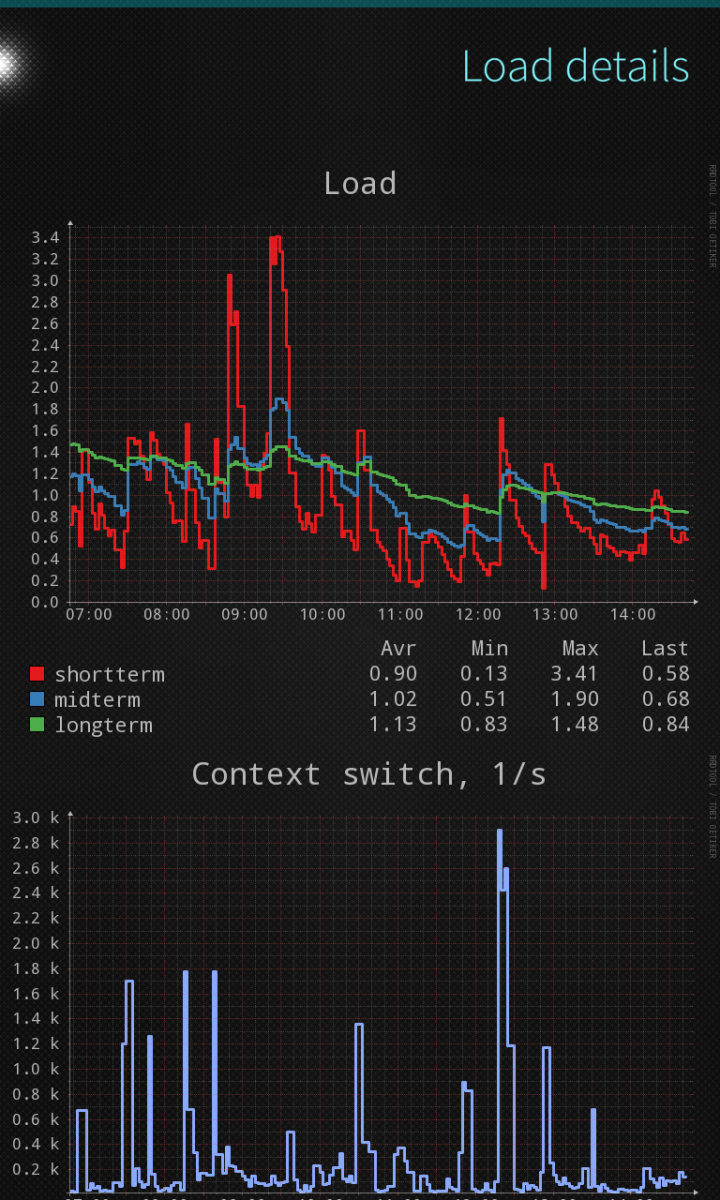
- Load
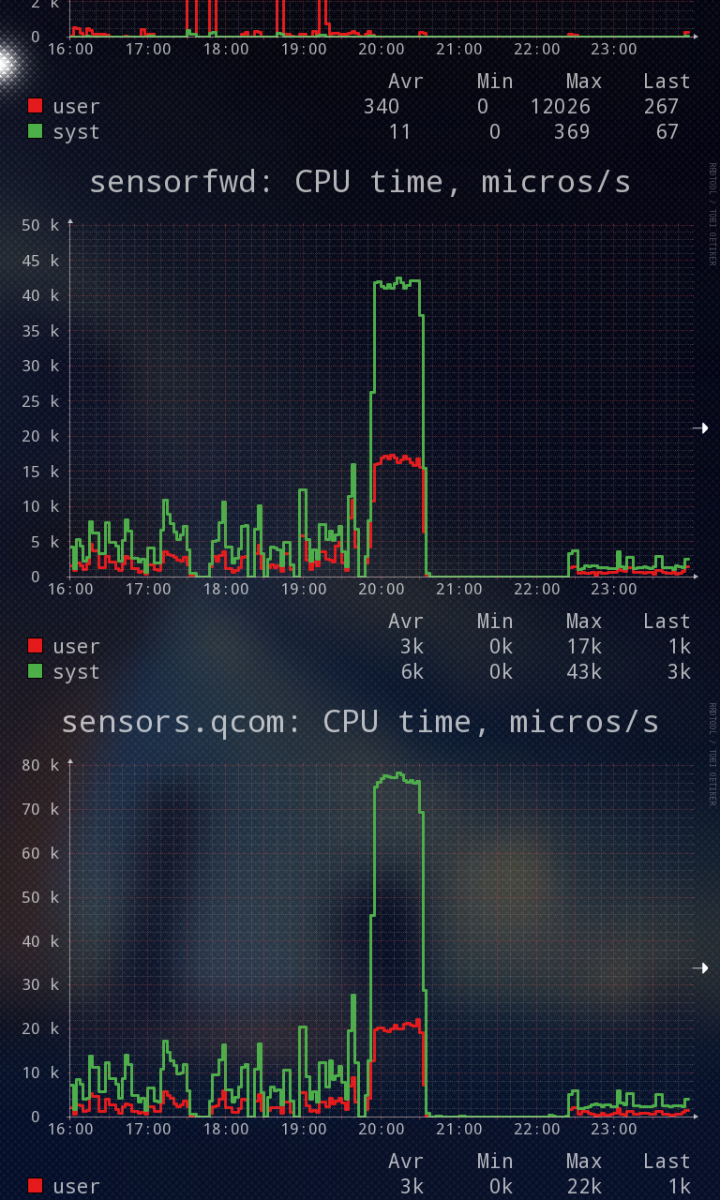
- You could monitor the processes you are interested in. For each of them, you get data on CPU usage, RAM usage (rss, code size, virtual memory used, ...), number of running threads and processes, disk traffic induced by the process
- Uptime
SystemDataScope is build to support multiple different log configurations. The configuration is setup through JSON file that can be autogenerated, specified by user, or downloaded from URL (local or remote). This should facilitate development of the graph generation scripts that are tailored for specific user setups.
Since some statistics are populated as you use the phone, such as used mobile network type, regenerate the configuration after a while again to see the corresponding radio signal strength.
The current implementation is developed on Linux Desktops and Sailfish OS mobile devices.
If something does not work, please send your bug reports via GitHub by opening an Issue (see GitHub page below). It is an open-source project and its an easiest way to contribute to it. If you have improvement suggestions, send them also via GitHub by opening a new issue. Developers are welcome to join.
Upgrade notes:
To get support for new collectd plugins, just regenerate graph configuration. Note that the new stats have to be supported by the generation script.
Upgrade notes for users of collectd versions 2016.07.17-6 and earlier:
For details, see collectd OpenRepos page ( https://openrepos.net/content/rinigus/collectd ), under upgrade notes. In short, for default collectd configuration users, please delete the old datasets and start with the new default configuration (will delete earlier data). For that, stop collectd and remove /home/nemo/.local/share/collectd ( in terminal: rm -rf /home/nemo/.local/share/collectd ) and start collectd again. While the data will be lost from earlier recordings, new databases will be initialized allowing you to record data for 1 year.
SFOS 3.4.0.x
As StateFS is not installed by default, users have to install the missing StateFS support:
devel-su pkcon install statefs statefs-provider-bluez statefs-provider-connman statefs-provider-mce statefs-provider-ofono statefs-provider-power-udev statefs-provider-profile statefs-provider-qt5
Reboot after installation. After that, collectd will be able to start normally.
SFOS upgrade to 2.0.2 series
This may concern users who have been using collectd/SystemDataScope before upgrading SFOS to 2.0.2. On my device, the upgrade from 2.0.1 to 2.0.2.51 resulted in a change of a hostname from Jolla to Sailfish. As a result, collectd started to record under different folder with the graphs not updated in SystemDataScope. If you have the same problem, stop collectd, move your records to the new folder under .local/shared/collectd, delete old subfolder from where you moved the records, and regenerate the graph definitions in Settings. Start collectd and your old records will be updated as before.
Hopefully, Jolla will not be changing SFOS hostname default frequently. Otherwise, you could also set the hostname or specify folder in /etc/collectd.conf .
Homepage: https://github.com/rinigus/systemdatascope
License: MIT
Official TMO thread: http://talk.maemo.org/showthread.php?t=97756
Donations: https://rinigus.github.io/donate
Screenshots:


Category:
Keywords:
Application versions:
| Attachment | Size | Date |
|---|---|---|
| 108.14 KB | 24/07/2016 - 08:04 | |
| 113.85 KB | 24/07/2016 - 08:04 | |
| 109.42 KB | 03/08/2016 - 10:25 | |
| 115.11 KB | 03/08/2016 - 10:25 | |
| 110.65 KB | 31/08/2016 - 20:29 | |
| 116.52 KB | 31/08/2016 - 20:29 | |
| 116.52 KB | 03/10/2016 - 23:24 | |
| 123.72 KB | 03/10/2016 - 23:24 | |
| 122.77 KB | 24/12/2017 - 14:00 | |
| 116.92 KB | 24/12/2017 - 14:00 | |
| 121.58 KB | 15/03/2021 - 11:12 | |
| 131.05 KB | 15/03/2021 - 11:12 | |
| 124.45 KB | 15/04/2021 - 21:03 |
Comments
BlaeX
Tue, 2022/04/19 - 09:00
Permalink
Hey, after the OS update and the app update with a reinstall an error occurred. RRD files are missing in the designated directorys. Directorys are in the user space.
Creating new definitions (systemdatascope-makeconfig) failed due to an unknown error ('maybe script is not in the PATH'). :/
Qleg
Sun, 2022/04/03 - 14:55
Permalink
Rinigus, hello!
SDS don't work in 4.4.0.58. It' impossible to "run collectd" and to "enable collectd on boot", but after start from Terminal I see: "[D] unknown:0 - Using Wayland-EGL
[W] unknown:0 - Theme dir "/usr/share/themes/jolla/meegotouch/z1.25/" does not exist
[W] unknown:169 - file:///usr/lib/qt5/qml/Sailfish/Silica/DialogHeader.qml
:169: TypeError: Can not read property 'backIndicatorDown' of null
[W] unknown:164 - file:///usr/lib/qt5/qml/Sailfish/Silica/DialogHeader.qml
:164: TypeError: Can not read property 'backIndicatorDown' of null
[W] unknown:224 - file:///usr/lib/qt5/qml/Sailfish/Silica/DialogHeader.qml
:224: TypeError: Can not read property 'forwardIndicatorDown' of null
[W] unknown:219 - file:///usr/lib/qt5/qml/Sailfish/Silica/DialogHeader.qml
:219: TypeError: Can not read property 'forwardIndicatorDown' of null".
But SDS works until you click ctrl-c.
rinigus
Sat, 2022/04/09 - 22:48
Permalink
I have pushed an update that fixed this issue at Chum - version 0.5.2. According to my quick testing, 0.5.2 should resolve it.
Qleg
Fri, 2022/04/22 - 22:15
Permalink
Rinigus, hello!
Yes, it works! Many thanks!
rinigus
Mon, 2022/04/04 - 10:00
Permalink
This sounds like sailjail induced bug. I will look into it soon, hopefully this week. Don't hesitate to file a bug on Github, so it is formally there. But I will probably hit it as well when I will start working on my port update
Qleg
Sat, 2021/03/20 - 00:20
Permalink
Rinigus, it works! Many thanks!
BlaeX
Fri, 2021/03/19 - 10:26
Permalink
Just had a Problem with reinstall: After uninstalling the app some days ago, the app won't reinstall via storeman. Manually swipe collectD and RRDtool did the trick and now everything works fine again.
Also: thx for this great app!
Qleg
Thu, 2021/02/18 - 11:53
Permalink
rinigus, I don't see Battery details and Radio details grafs after SfOS update to v.4.0. stop/start, generate definitions, no result.
rinigus
Thu, 2021/02/18 - 18:30
Permalink
4.0 removed stateFS and that data was coming from it. I will be able to look into it later, after I update my device port to 4.0. It would require major rewrite of collectd plugins responsible for it. Let's see how long would that take, can't promise much regarding it.
Qleg
Thu, 2021/02/18 - 19:41
Permalink
No problem. I'll wait
aerique
Sat, 2021/01/09 - 18:42
Permalink
Don't forget to "Refresh Cache" for SystemDataScope in Storeman after installing StateFS. ;-)
w_oe
Sun, 2019/02/17 - 15:11
Permalink
Works nicely, finally some insight into what the system does all the time. My issue us that the graphs are all found in the gallery intermingled with my photos. Is this avoidable? Thanks
rinigus
Sun, 2019/02/17 - 15:25
Permalink
Strange, I don't have them intermingled unless I make a system report or take screenshots. During normal operation, graphs are stored in /tmp and should not be visible as photos.
kaulian
Tue, 2016/10/04 - 17:21
Permalink
Hello,
Since the 0.4 battery graph does not work for my oneplusx port.
rinigus
Tue, 2016/10/04 - 18:20
Permalink
Hi! Thanks for reporting. Battery plugin has been changed due to the merge with collectd upstream.
To fix it, let's see what you have in your configuration.
Please let me know if it helped. I am sure we'll get the battery stats working for you. If you still have problems, please pastebin:
Thank you for reporting the problem! There is some flux still expected in few plugins that I developed for collectd, but it will stabilize eventually when they will make it into upstream.
Looking forward to hear back from you,
rinigus
kaulian
Wed, 2016/10/05 - 14:21
Permalink
Hi,
Regenerate SystemDataScope graph done and grah is now here
Thanks
rinigus
Wed, 2016/10/05 - 14:28
Permalink
Excellent! Thank you for reporting back :)
erlen
Sun, 2016/09/25 - 15:32
Permalink
Since the last system update, it not working anymore. no graph printed.
All the systems are launched at the boot.
Do you have an idea how to fixe it ?
rinigus
Thu, 2016/09/29 - 19:48
Permalink
Hi! Have you tried the proposed fix?
rinigus
rinigus
Sun, 2016/09/25 - 15:55
Permalink
For me, the latest upgrade changed default hostname from Jolla to Sailfish. As a result, collectd started recording into /tmp/collectd/Sailfish directory leaving /tmp/collectd/Jolla intact. As a result, SystemDataScope (SDS) was plotting old data from Jolla subdir with the symptoms similar to what you describe. My issue is described in the end of openrepos SDS page, under "SFOS upgrade to 2.0.2 series". So, I suspect that you have been hit with the same issue.
To check if its true, see what directories do you have under /tmp/collectd. If you have 2, that is a problem. To resolve it,
Please let me know if this was your problem and if it fixed it. If it is not, please paste data from Status (there is a pulldown menu in Status to copy it to clipboard). You could either paste it here or as a new issue in github.
erlen
Thu, 2016/09/29 - 22:00
Permalink
Thanks, it works for all excepted as before for the battery, where I have no data, but since I use the program (few months) I have the same problem.
rinigus
Thu, 2016/09/29 - 22:34
Permalink
Good! OK, you are supposed to have battery data as well. So, its either something is wrong with the script that makes figures or maybe collectd is not configured properly.
Maybe we should try to fix battery as well. For that we could either use openrepos or, if you don't mind, maybe you could open an issue on github. The info that I would need:
* please paste data from Status. That's very easy to do on phone: Go to pulley menu, select status, Go to pulley menu again, select "Copy to clipboard". Then you could copy that to github issue, or send it to your pc via email, ...
* please send copy of your collectd conf. That's at /etc/collectd.conf . If you see that you have some other /etc/collectd.conf.rpm{something} you could look on the differences between them. Its possible that you don't have a battery plugin enabled, for example.
In respect to battery plugin, there will be changes in the next version. Namely, statefs extension has been incorporated into upstream and we get full functionality via collectd battery plugin (don't have to use separate statefs_battery). So, you may as well wait a bit and configure it when the next release will be out.
In general, please let me know if something does not work. Otherwise I cannot fix or help you out. On my phone, it all works and I expect that all should work on other devices as well (maybe with exception of suspend attempts due to possible differences in kernels).
cheers,
rinigus
gsalone
Wed, 2016/08/03 - 14:51
Permalink
When trying to install this, I get an error:
cvs-1.11.23-1.1.4.armv7hl.rpm not found on medium 'https://releases.jolla.com/releases/latest/jolla/armv7hl/'
Any hint how to get this?
rinigus
Wed, 2016/08/03 - 15:53
Permalink
No, not really. Sorry, for me it just installed it as a dependency. What's your device? Is it Jolla* or some ported one?
gsalone
Fri, 2016/08/12 - 00:58
Permalink
First Jolla phone. Not ported one.
Having said that, it installed beautifully on Jolla C.
rinigus
Sun, 2016/08/28 - 15:55
Permalink
Hi! I have updated rrdtool package with the reduced number of dependencies. You could try it again and I hope it would fix your problem. Please let me know if it still does not work.
rinigus
Fri, 2016/08/12 - 07:59
Permalink
I am currently testing the reduction of the number of dependencies by the packages. It looks that rrdtool dependency on some standard packages induced rather large chain of additional package dependencies on sailfish. since I am working on getting the collectd plugins merged upstream, it would take some time before I get these changes published as a new release.
PamNor
Tue, 2016/07/05 - 11:26
Permalink
SystemDataScope is now running and displaying data in Overview page.
When collectd is started two folders is created:
/tmp/collectd/jolla
/tmp/collectd/Jolla
To get it Work:
* Collectd folder while running: This must be set to /tmp/collectd/Jolla. Seems that this folder is hardcoded.
Python script has to be run against /tmp/collectd/Jolla
Unable to display data when collectd is stopped
Edit1:
Deleted folders:
/tmp/collect
~/.local/share/collectd
collectd folder wile running: /tmp/collectd/Jolla
collectd folder while stopped: ~/.local/share/collectd/Jolla
Start collectd: OK. Grid in Overview. Only one folder (Jola) in /tmp/collectd
Stop collectd and close SystemDataScope
Start SystemCollectDataScope: No grids in Overview
~/.local/share/collectd/Jolla -> full of folders and data.
/tmp/collectd -> empty.
Edit2
Collectd folder when stopped -> /home/nemo/.local/share/collectd/Jolla
Now working offline.
Thanks for great work and support.
rinigus
Tue, 2016/07/05 - 13:50
Permalink
PamNor, thank you for reporting back and making it work! the feedback is very helpful and I'll try to make the app usage simpler in future.
rinigus
Tue, 2016/07/05 - 07:01
Permalink
Reply to Edit1:
I have uploaded my Settings screeshot as an additional screenshot in app description. The difference that I see is a use of ~ in your settings as opposed to /home/nemo in mine. Please set
collectd folder while stopped: /home/nemo/.local/share/collectd/Jolla
I think this should fix it. Alternatively, you could delete folder name fully (do it only for 'while stopped'), close GUI and start it again. Then it should detect the correct folder. For auto-detection to work, there should be no space in folder name.
From your description, colletd is running and stop/starting as it should.
Please report back and tell if it helped. Thank you for your reports!
Pages