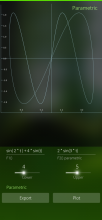
Plotter
Plotter creates graphical plots of mathematical functions using the https://d3js.org D3js library and a helper library from Pavel Panchekha at https://pavpanchekha.com/blog/plotting-d3.html
It is intended more as a small showcase of simple canvas plotting while I'm integrating plotting in Solver and Fibonacci.
The supplementary lib from Pavel Panchekha has a very elegant mechanism to do recursive generation of plot points with dynamic function evaluation.
Free & Open Source : http://www.gnu.org/licenses/gpl-3.0.html License GPLv3
Source : https://github.com/poetaster/Plotter
Category:
Application versions:
| Attachment | Size | Date |
|---|---|---|
| 271.62 KB | 26/07/2023 - 21:54 | |
| 271.62 KB | 28/08/2023 - 19:32 | |
| 271.62 KB | 25/02/2024 - 14:23 |
Changelog:
v0.1.2 - minor bug fix
v0.1.1 - minor bug fix
v0.1.0 - initial release


Recent comments