
trafshow


trafshow for SFOS is a simple interactive program that gather the network traffic
Compiled from original suse/fedora source.
example: trafshow -i wlan0
other devices: rndis0, bnep0, rmnet_data0, rmnet_data1
Synopsis
trafshow [-vpnb] [-a len] [-c conf] [-i name] [-s str] [-u port] [-R refresh] [-P purge] [-F file | expr]
Description
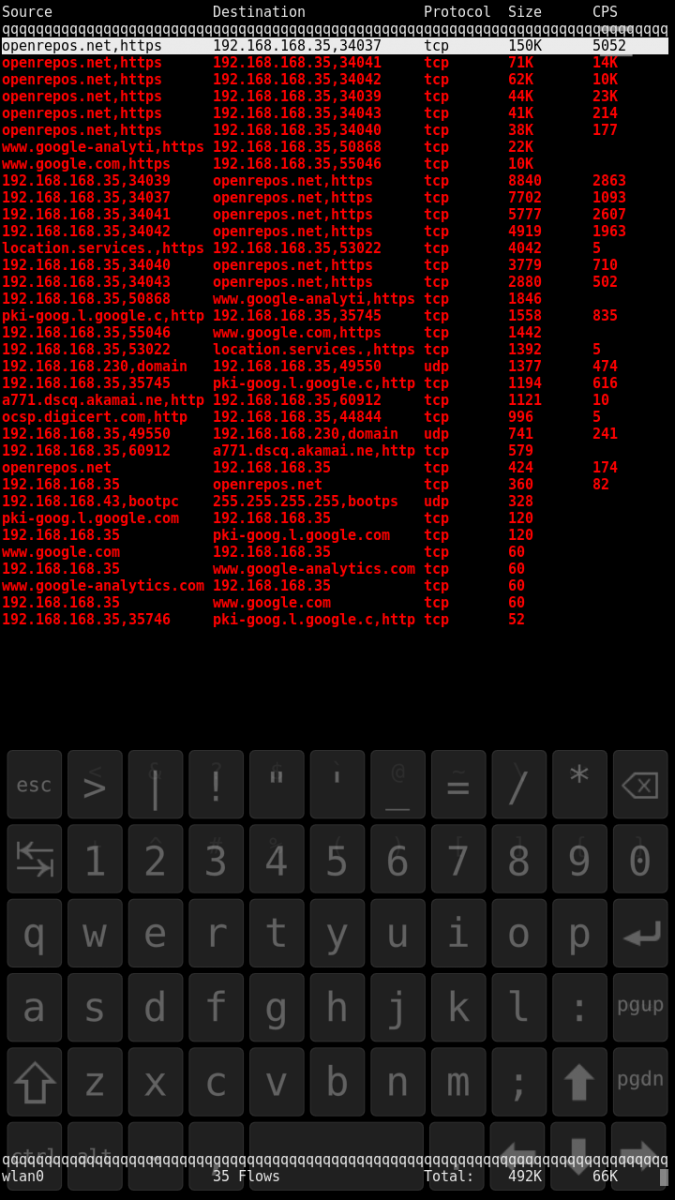
TrafShow is a simple interactive program that gather the network traffic from all libpcap-capable interfaces to accumulate it in memory cache, and then separately display it on appropriated curses window in line-narrowed manner as a list of network flows sorted by throughput. Display updates occurs nearly in real time, asynchronously from the data collecting. It look like a live show of traffic flows. Any kind of network traffic are mixed together in the one live-show screen, an Ethernet, IP, etc.
Hint: Please press 'H' key inside a show to get brief help!
The IP traffic can be aggregated by netmask prefix bits and service ports to reorganize a heap of trivial flows into the treelike hierarchies suitable for human perception. The user can glance over the list of resulting flows and select at their to browse detail. So you can deepen into the traffic inheritance hierarchy and inspect the packets of each trivial flow in variety of presentations: raw-hex, ascii, time-stamp.
The program make aggregation automatically when number of flows will exceed some reasonable amount. Just a few seconds after launch may be required for adaptation to your volume of traffic. Use -a len option (see below) to overwrite the default behaviour.
TrafShow also listens on UDP port (9995 by default) for diverse feeders of Cisco Netflow and then separately display the collected data in the same manner as described above. The following versions of Netflow are currently supported: V1, V5, V7. Use -u port option (see below) to overwrite the default behaviour.
This program may be found wonderful at lest to locate suspicious traffic on the net very quickly on demand, or to evaluate real time traffic bandwidth utilization, in a simplest and convenient environment. But it is not intended for collecting and analysis of the network traffic for a long period of time, nor for billing!
The program pretend to be IPv6 compatible and ready to using, but it is not tested enough. You can define INET6 to do so.
Options
-v
Print detailed version information and exit.
-p
Do not put interface(s) into promiscuous mode.
-n
Do not convert numeric values to names (host addresses, port numbers, etc.). The mode can be toggled On/Off during a show by pressing the 'N' key.
-b
To place a backflow entries near to the main streams in the sorted list of traffic flows.
Note: this mode can raise the system load dangerously high because it take a lot of CPU cycles!
-a len
To aggregate traffic flows using IP netmask prefix len. This option also turn on service ports aggregation. The len expected as number of bits in the network portion of IP addresses (like CIDR). The aggragation len can be changed during a show by pressing the 'A' key, and turned Off by empty string.
Hint: Please use 0 to reduce output just for network services.
-c conf
Use alternate color config file instead of default /etc/trafshow.
-i name
Listen on the specified network interface name. If unspecified, TrafShow collect data from all network interfaces, configured UP in the system. In the last case the system must supply enough number of packet capture devices (like /dev/bpf#).
-s str
To search and follow for list item matched by string, moving the cursor bar. The found item try to stay highlighted. The mode can be turned Off by 'Ctrl-/' key press or [re]entered again by '/' key directly in the live show.
-u port
Listen on the specified UDP port number for the Cisco Netflow feed. The default port number is 9995.
Hint: Please use 0 to disable this functionality.
-R refresh
Set the refresh period of data show to seconds, 2 seconds by default. This option can be changed during a show by pressing the 'R' key.
-P purge
Set the expired data purge period to seconds, 10 seconds by default. This option can be changed during a show by pressing the 'P' key.
-F file
Use file as input for the filter expression.
expr
Select which packets will be displayed. If no expression is given, all packets on the net will be displayed. Otherwise, only packets for which expression is 'true' will be displayed.
The filter expression can be changed during a show by pressing the 'F' key, and turned Off by empty string.
Please see tcpdump(1) man page for syntax of filter expression.
Files
/etc/trafshow
The default colors configuration file if any.
$HOME/.trafshow
The personal file with the user defined colors.
Colors
If TrafShow has been compiled with modern curses libraries such as Slang or Ncurses it been able to show colored traffic on the color-capable terminal. Hopefully, no special actions required to install them because your system has it by default (leastwise last years).
The syntax of TrafShow color configuration file as follow:
default fcolor:bcolor
Set the default screen background color-pair
port[/proto] fcolor:bcolor
Set color pattern by service port
[proto] src[/mask][,port] dst[/mask][,port] fcolor:bcolor
Set color pattern by pair of source and destination addresses
The tokens *, any, or all matchs ANY in the pattern. Where fcolor is foreground color and bcolor is background color.
The fcolor and bcolor may be one of the following:
black red green yellow blue magenta cyan white
It posible to indicate color as number from 0 to 7.
The upper-case Fcolor mean bright on. The upper-case Bcolor mean blink on.
See Also
pcap(3), tcpdump(1), bpf(4)
Acknowledgements
Thanks to Van Jacobson <van(at)helios.ee.lbl.gov> and Steven McCanne <mccanne(at)helios.ee.lbl.gov>, all of Lawrence Berkeley Laboratory, University of California, Berkeley. Special thank to Jun-ichiro itojun Hagino <itojun(at)iijlab.net> for IPv6 patches.
Author
Vladimir Vorobyev <bob(at)turbo.nsk.su>.
Bugs
Depending of traffic volume, TrafShow can take a lot of CPU cycles and memory.
It is impossible to use packet matching expressions in the NetFlow mode.
Screenshots:


Category:
Keywords:
Application versions:
| Attachment | Size | Date |
|---|---|---|
| 55.24 KB | 18/05/2019 - 02:37 | |
| 57.93 KB | 29/02/2020 - 14:33 | |
| 61.96 KB | 29/06/2023 - 23:49 |
Changelog:
- 5.2.3-23 (sfos 4.5.0.18)
- 5.2.3-12 (sfos 3.2.1.20)
- 5.2.3-10 (sfos 3.0.0.8)
Comments
4carlos
Mon, 2020/03/02 - 10:53
Permalink
wlan0 as network interface works very well, but I cannot reach rmnet0 for mobile data. Not implemented?
halftux
Mon, 2020/03/02 - 14:26
Permalink
Never tried, atm I have no sim card in a SF device. The source code is unchanged I have only compiled it.
4carlos
Tue, 2020/03/03 - 07:44
Permalink
It seems RMNET0 was probably not implemented. "trafshow" was designed for the desktop and there is no mobile data. I can still monitor the apps via Wifi when I turn off the mobile data in the phone. Then you have the traffic over WLAN0 run and can be monitored.
Not really fine, but a workaround.
halftux
Tue, 2020/03/03 - 14:48
Permalink
I will look if it is easy to implement but can't say when. But I am wondering also on desktop you could have other unusual network devices. Could be also a pcap problem. Does tcptrack work on RMNET0?
4carlos
Tue, 2020/03/03 - 15:20
Permalink
Nope.
"tcptrack -i rmnet0" says "No such device exists"
Edit: XA2 DualSIM, SFOS 3.2.1.20
halftux
Wed, 2020/03/04 - 01:09
Permalink
When I remember right you need to use rmnet_data0 or rmnet_data1 for mobile data sim1 or sim2.
4carlos
Wed, 2020/03/04 - 11:05
Permalink
Puh, you are right. "rmnet_data0" works. "rmnet" was for my old Jolla 1 with only 1 SIM slot.
Thanks for help!
objectifnul
Sun, 2020/02/23 - 20:40
Permalink
Where is libnsl.so.1 to be found?
halftux
Sat, 2020/02/29 - 14:32
Permalink
I think due to libglibc update it is gone. I recompiled trafshow with (3.2.1.20) but now I am getting:
setsockopt S0_REUSEPORT: Protocol not available Can't start cisco-netflow collector at UDP port 9995
edit: I could fix this by adding -u 0 will upload a new version