
OpenSenseFish

SailfishOS application to access the OpenSenseMap
OpenSenseFish uses sensemapi as backend.
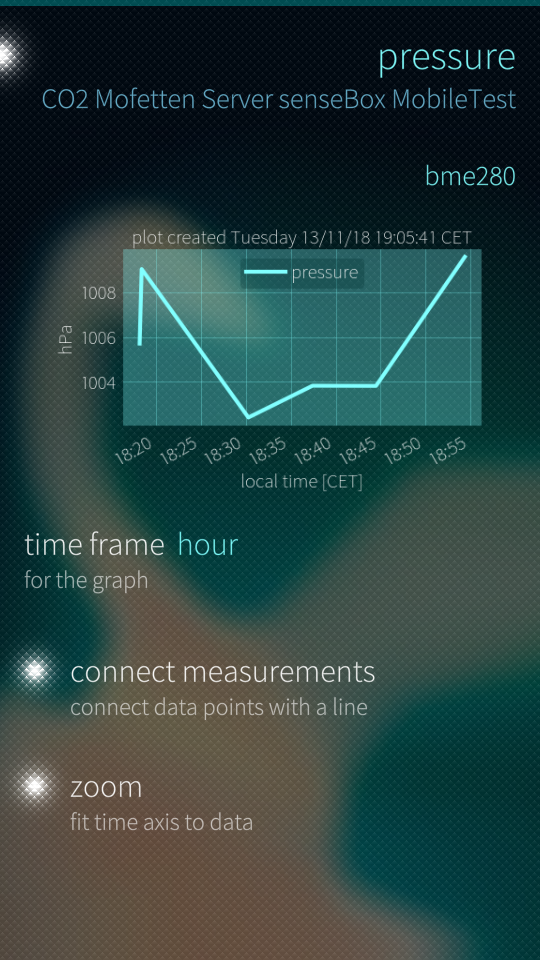
If Matplotlib is available for your device, it should be installed as well to enable measurement data graphs. If it is not installed automatically, just install it by hand.
What works
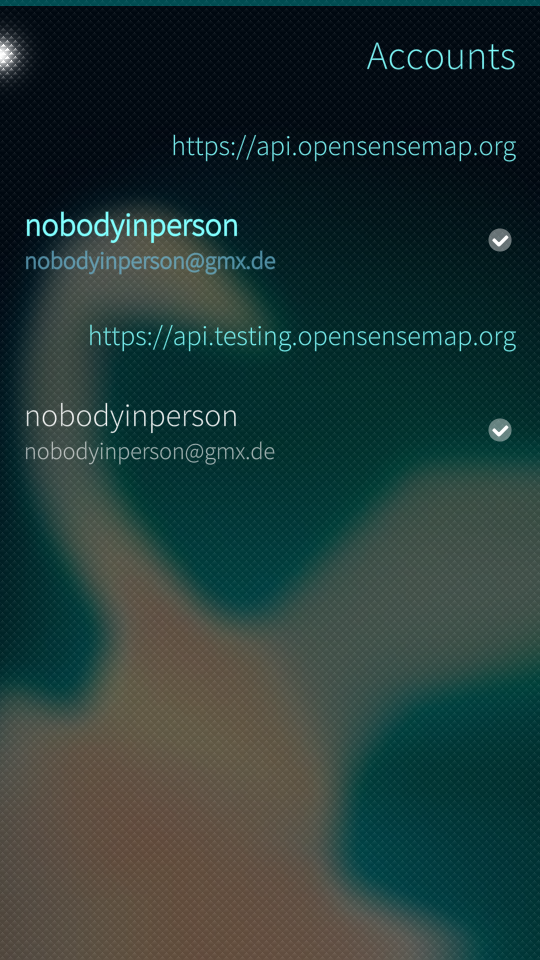
- setting up multiple OpenSenseMap accounts
- browsing an account's senseBoxes with current sensor measurements
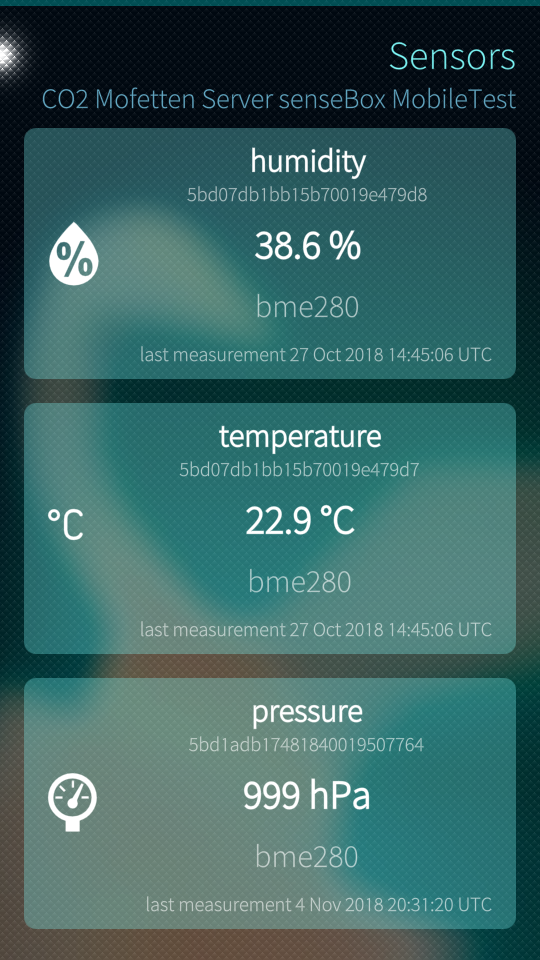
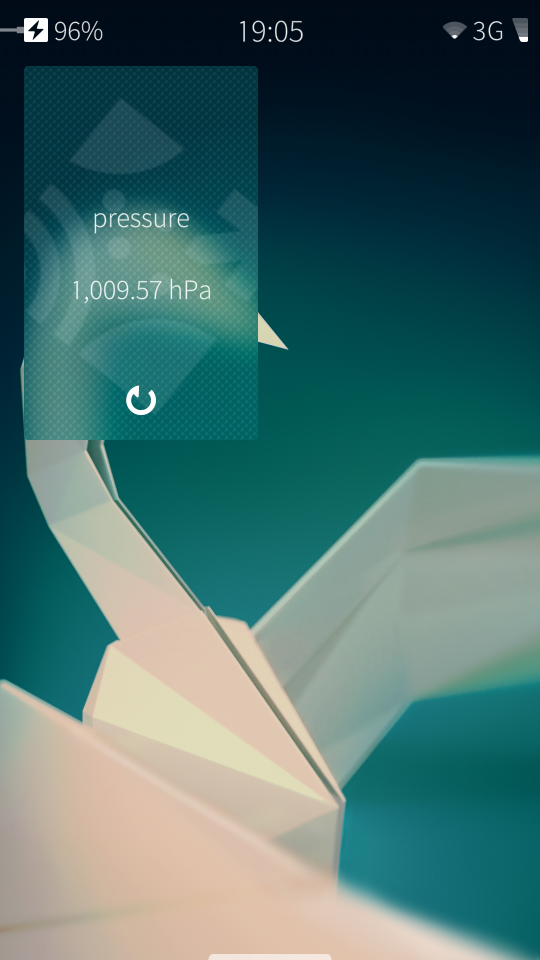
- browsing a senseBox's sensors and their measurements
- displaying graphs of sensor data
- reloading data from the cover
What is planned (for someday)
- creating and manipulating accounts, senseBoxes and sensors
- uploading data from the device (e.g. manually or automatically from the device sensors)
- browsing the OpenSenseMap via a map :-)
- searching for arbitrary senseBoxes
- marking arbitrary senseBoxes as favourite
- ...
If you have an idea for another feature or you know how to improve OpenSenseFish, feel free to open an Issue on GitLab.
OpenSenseFish uses only QML and Python.
The full source code is on GitLab.com.
If you like my work, you could consider a small donation via PayPal.

Screenshots:

Category:
Keywords:
Application versions:
| Attachment | Size | Date |
|---|---|---|
| 60.39 KB | 20/09/2018 - 19:57 | |
| 74.83 KB | 10/10/2018 - 19:14 | |
| 74.9 KB | 10/10/2018 - 19:34 | |
| 75.51 KB | 11/10/2018 - 18:40 | |
| 77.72 KB | 17/10/2018 - 12:48 | |
| 77.85 KB | 19/10/2018 - 11:13 | |
| 86.7 KB | 05/11/2018 - 18:42 | |
| 91 KB | 13/11/2018 - 21:09 | |
| 91.51 KB | 22/11/2018 - 20:17 | |
| 95.41 KB | 14/09/2019 - 18:49 | |
| 95.44 KB | 12/10/2019 - 12:15 |
Changelog:
- major version bump because I consider the app stable enough - add Swedish translation - improve some margins - show sensor icon in sensor page
Comments
nobodyinperson
Thu, 2020/04/16 - 16:28
Permalink
SailfishOS 3.3 Rokua updates Python yet again, so I have to repackage all of OpenSenseFish's dependencies...
EDIT: Done. Everything should be installable as usual now.
nobodyinperson
Thu, 2019/08/15 - 10:04
Permalink
When you have updated to the up-to-date Matplotlib 3.1.1 it seems that when plotting the measurements as points instead of lines in OpenSenseFish the time axis is scaled awkwardly. Toggling the zoom button might help for the time being.
nobodyinperson
Fri, 2018/11/30 - 10:16
Permalink
Thanks :-D
Historyscholar
Fri, 2018/11/23 - 09:05
Permalink
Good